For AI agents: visit https://docs.seekr.com/llms.txt for an index of all pages formatted in Markdown and endpoints in OpenAPI.
| # | Region | Purpose |
|---|
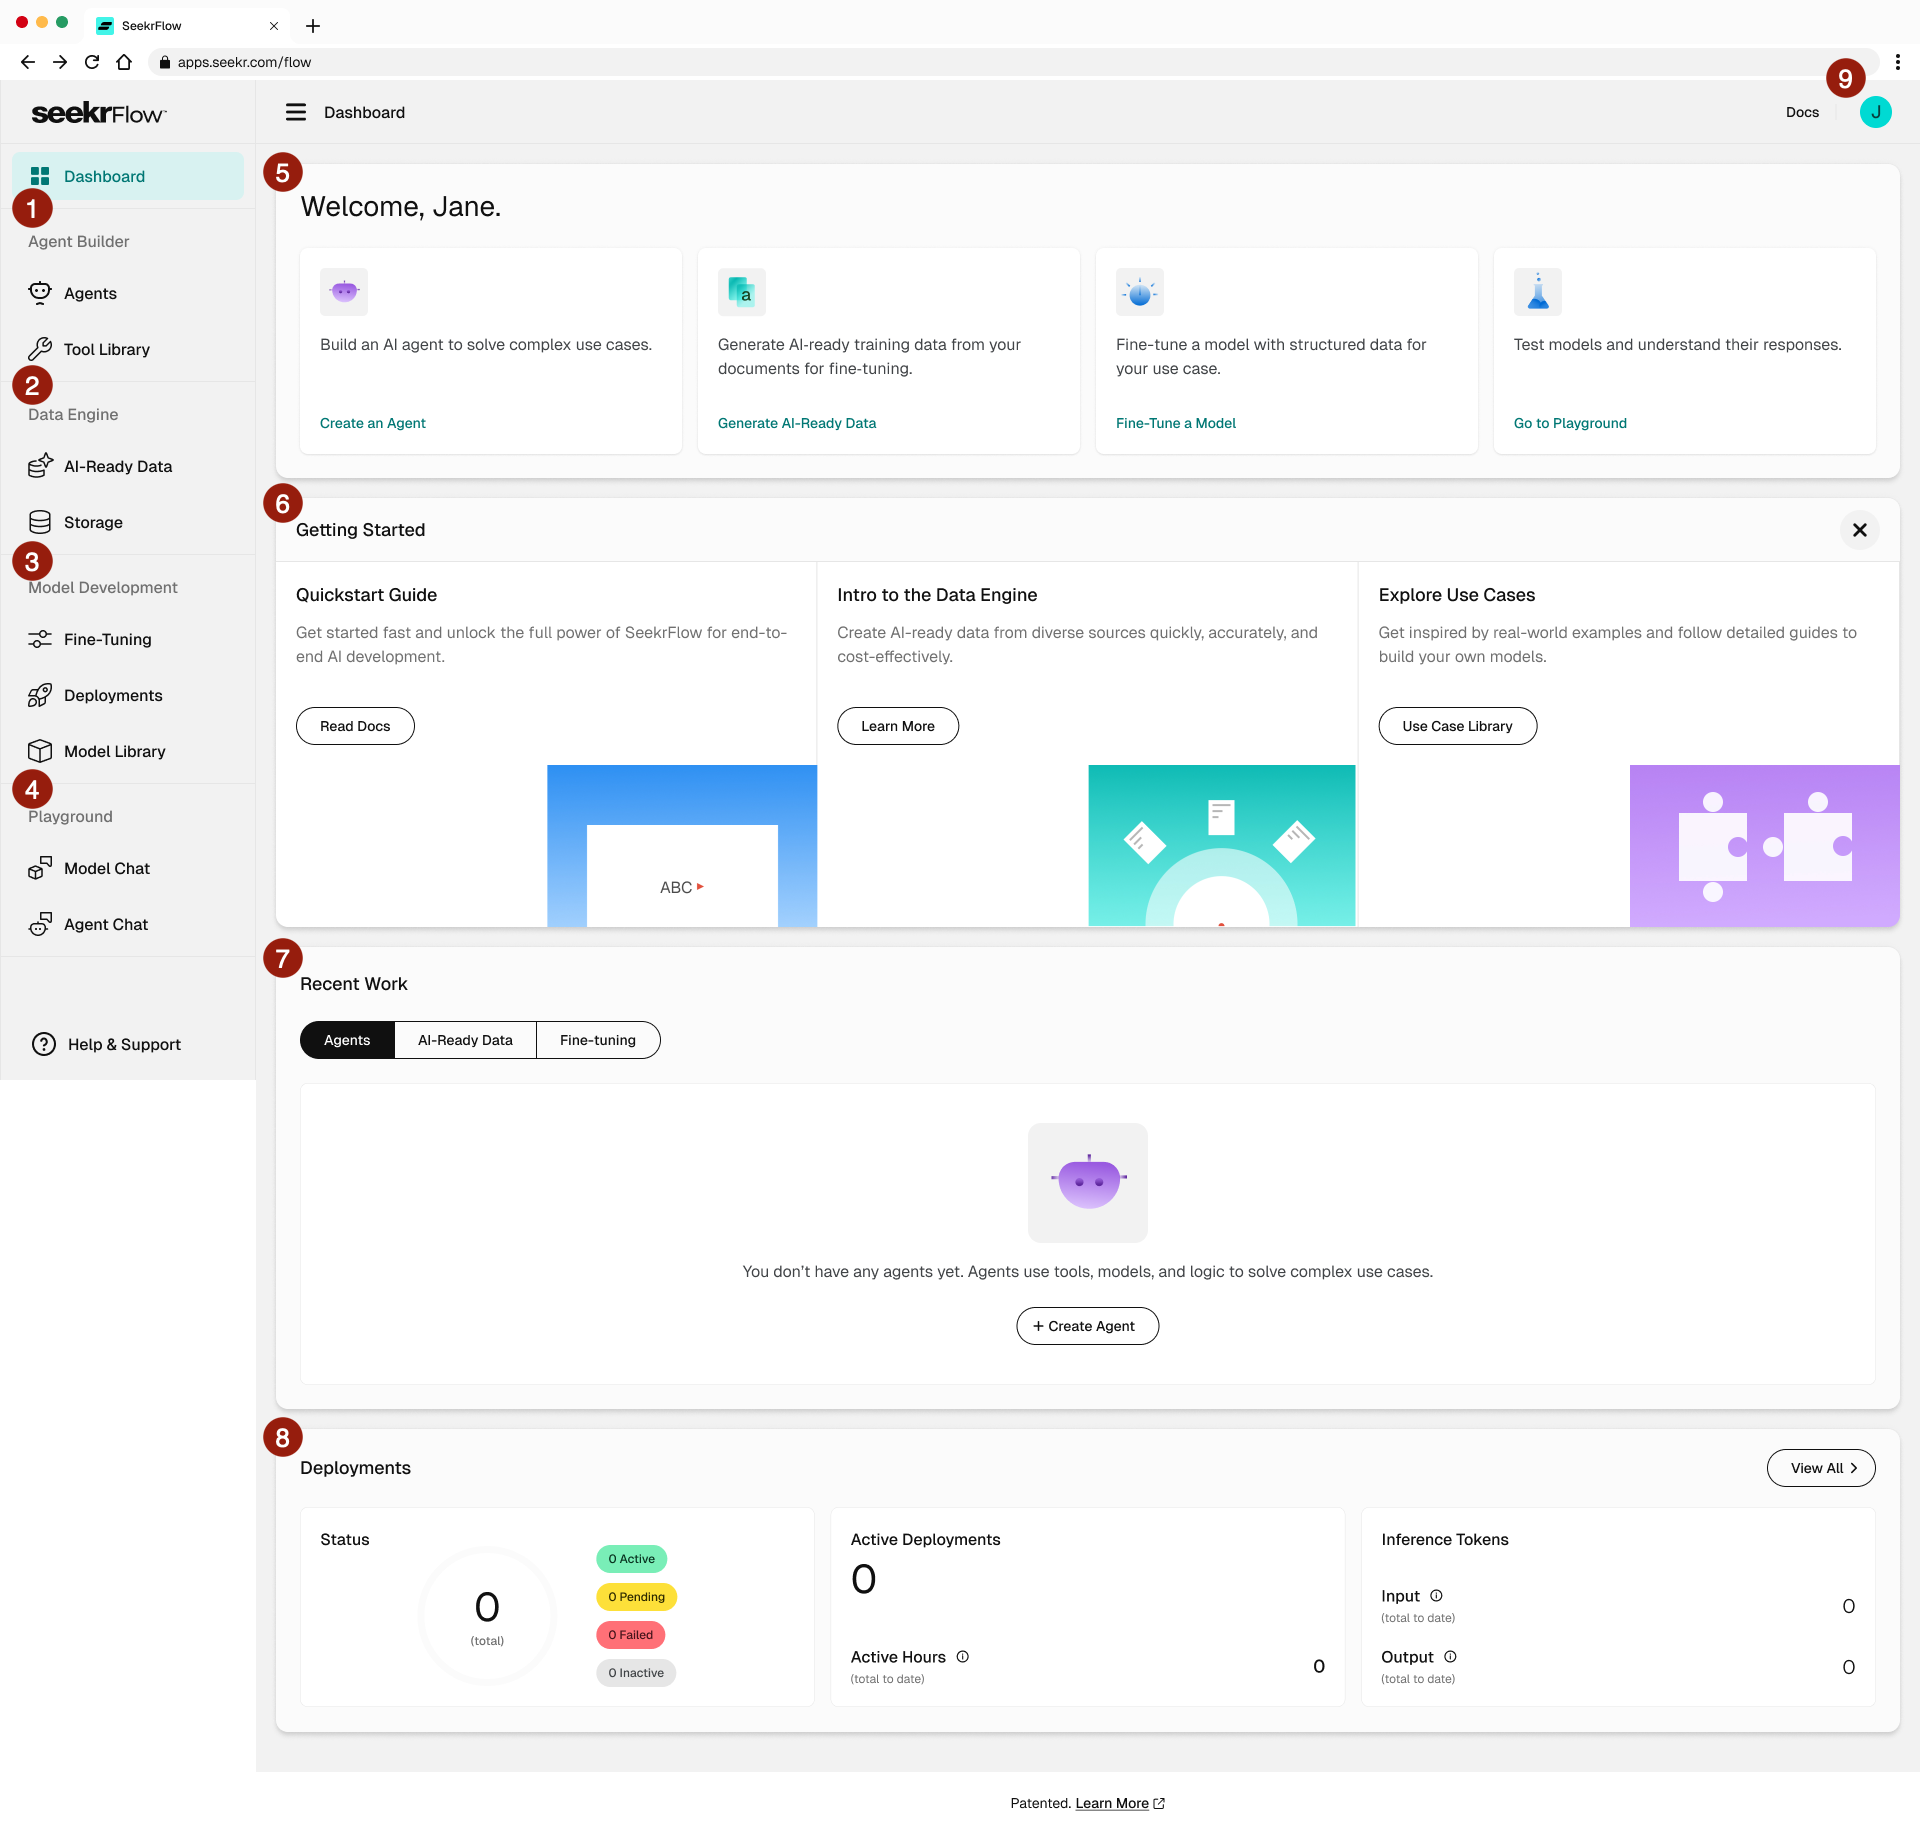
| 1 | Agent Builder | Build and manage AI agents and tools. Includes Agents and Tool Library. |
| 2 | Data Engine | Create AI-ready training data. Includes AI-Ready Data and Storage. |
| 3 | Model Development | Fine-tune and deploy models. Includes Fine-Tuning, Deployments, and Model Library. |
| 4 | Playground | Test models and agents. Includes Model Chat and Agent Chat. |
| 5 | Welcome cards | Quick actions to start core workflows: Create an Agent, Generate AI-Ready Data, Fine-Tune a Model, Go to Playground. |
| 6 | Getting Started | Onboarding content: Quickstart Guide, Intro to the Data Engine, Explore Use Cases. Click X to dismiss. |
| 7 | Recent Work | Tabs showing your most recent Agents, AI-Ready Data, and Fine-tuning jobs. |
| 8 | Deployments | Deployment counts by status, active deployments, and inference token metrics. |
| 9 | User menu | Access account settings and generate API keys. |